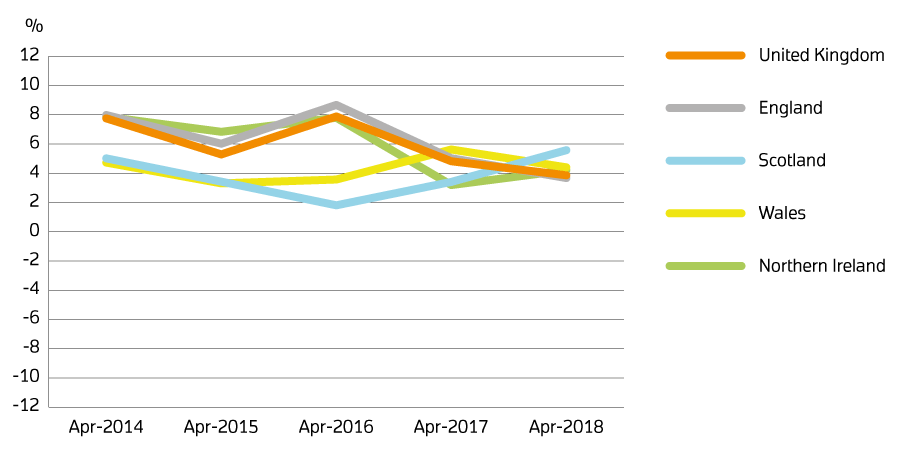
In England, the April data shows on average, house prices have risen by 1.1% since March 2018, according to HM Land registry. Scotland has up trend in price changes.

In London, on average, house prices have risen by 2.4% since March 2018. An annual price rise of 1% takes the average property value to £484,584.
Average price by property type for London
| Property type | April 2018 | April 2017 | Difference % |
|---|---|---|---|
| Detached | £895,301 | £899,133 | -0.4 |
| Semi-detached | £592,142 | £567,701 | 4.3 |
| Terraced | £504,596 | £488,136 | 3.4 |
| Flat/maisonette | £425,045 | £428,541 | -0.8 |
| All | £484,584 | £479,790 | 1.0 |
Funding and buyer status for London
| Transaction type | Average price April 2018 | Annual price change % since April 2017 | Monthly price change % since March 2018 |
|---|---|---|---|
| Cash | £511,195 | 0.3 | 2.7 |
| Mortgage | £476,438 | 1.2 | 2.3 |
| First-time buyer | £424,029 | 0.8 | 2.3 |
| Former owner occupier | £546,563 | 1.2 | 2.5 |
Building status for London
| Building status* | Average price February 2018 | Annual price change % since February 2017 | Monthly price change % since January 2018 |
|---|---|---|---|
| New build | £514,619 | 2.9 | 4.7 |
| Existing resold property | £473,538 | -0.3 | -0.8 |
*Figures for the 2 most recent months are not being published because there are not enough new build transactions to give a meaningful result.
Sales volumes for London
The most up-to-date HM Land Registry sales figures available for London show the number of completed house sales in February 2018 fell by 23.9% to 5,411 compared with 7,108 in February 2017
| Month | Sales 2018 | Sales 2017 | Difference % |
|---|---|---|---|
| January | 6,092 | 6,931 | -12.1 |
| February | 5,411 | 7,108 | -23.9 |


