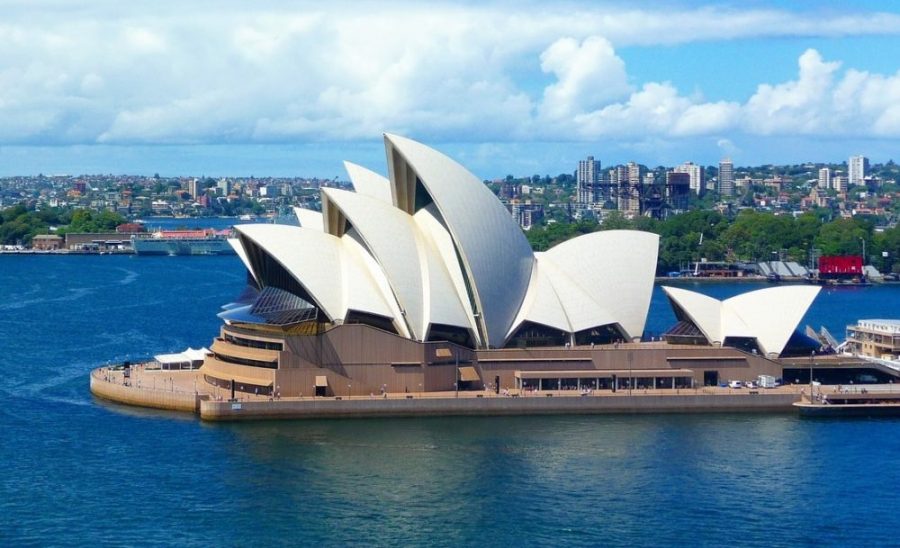
Australia is fast becoming an ideal destination for the world’s wealthiest millionaires.
According to Sydney Morning Herald, Australia had a net-inflow of 10,000 millionaires in 2017, with 90% of investors are from China.
The number of millionaires streaming into Australia has surged to 7260 in the past year, new figures show, delivering a multibillion-dollar investment boost as Australia becomes the destination of choice for thousands of the world’s wealthiest individuals.
Visa applications in the Business Innovation and Investment Programme, which includes investors with more than $1 million in business assets, jumped by 74 per cent in 2016-17 up from 5781 to 9051. Of those 7260 were approved, compared to 6484 in 2014-15, according to SMH.
In a recent study, United States, Canada and Australia are the three countries, attracting such wealthy millionaires and wealthy is leaving one country to another because of new trends in investment migration.
Australia introduced SIV stream on 24th November 2012 and the PIV stream was introduced 1 July 2015
The “significant investor stream” asks investors to invest up $5 million for Australian bonds, shares and venture capital projects. By March 2018 up to 2000 had been approved, delivering a $10 billion to the Australian economy.
During the 2017 to Q1 2018, Australia also granted 371, 746 business visas, according to Department of Home Affairs.
Business Innovation and Investment visa (subclass 188)
HNWIs can apply for any one of the stream and must own and manage a business in Australia (the Business Innovation stream), conduct business and investment activity in Australia (the Investor stream, the Significant Investor stream and the Premium Investor stream) or undertake an entrepreneurial activity in Australia (Entrepreneur stream).
- have experience in owning and operating a business (Business Innovation stream) or
- have at least AUD 1.5 million to invest (Investor stream) or
- have at least AUD 5 million to invest (Significant Investor stream) or
- have at least AUD 15 million to invest (Premium Investor stream)
There are no English-language requirements for the Significant Investor Visa and Premium Investor Visa, and no upper age limits, high quality of life makes it attractive for HNWIs.
As of 31 March 2018, 1974 SIV visas have been granted from the commencement of the program 24 November 2012 and SIV visas alone generated close to AUD 10 billion , according to Australian Government.
Brexit
Bloomberg reported, rich and wealthy are fleeing . Rich Chinese and Indians opt for the U.S. or Canada, Russians also choose the UK and Cyprus.
“Over the past 30 years, the United Kingdom has been one of the biggest recipients of migrating HNWIs,” the report said. “However, this trend changed in 2017 when the country experienced its first major HNWI net outflow.”
About 5,000 high net-worth individuals left the U.K. during 2017 and only about 1,000 arrived, the report shows.
Statistics
Significant Investor Visa – Subclass 188 (primary applications only) by programme year.
|
Programme Year |
Applications lodged |
Visas granted |
|
2012/2013 |
306 |
<5 |
|
2013/2014 |
723 |
286 |
|
2014/2015 |
1544 |
592 |
|
2015/2016 |
213 |
552 |
|
2016/31 May 2017 |
356 |
390 |
Business Innovation Stream – Subclass 188 (primary applications only) by programme year.
|
Programme Year |
Applications lodged |
Visas granted |
|
2012/2013 |
429 |
46 |
|
2013/2014 |
1058 |
445 |
|
2014/2015 |
1455 |
807 |
|
2015/2016 |
1478 |
1218 |
|
2016/31 May 2017 |
2101 |
1140 |
Investor Stream – Subclass 188 (primary applications only) by programme year.
|
Programme Year |
Applications lodged |
Visas granted |
|
2012/2013 |
54 |
<5 |
|
2013/2014 |
113 |
25 |
|
2014/2015 |
228 |
76 |
|
2015/2016 |
428 |
130 |
|
2016/31 May 2017 |
534 |
194 |
Premium Investor Visa – Subclass 188 (primary applications only) by programme year.
|
Programme Year |
Applications lodged |
Visas granted |
|
2015/2016 |
0 |
0 |
|
2016/31 May 2017 |
0 |
0 |
| Applicants – top five source countries | Percentage of total visa applications | Grants – top five source countries | Percentage of total visas granted |
|---|---|---|---|
| China | 88.1 | China | 86.5 |
| Hong Kong | 1.9 | Hong Kong | 3.2 |
| Malaysia | 1.1 | Malaysia | 1.4 |
| South Africa | 0.9 | South Africa | 1.3 |
| Vietnam | 0.9 | Vietnam | 0.9 |
.
Which economies invest in Australia?
The United States, United Kingdom and Belgium are the biggest economy countries investing in Australia, according to DFA.
2017, A$ billion
| Rank in 2017 | Economy | 2015 | 2016 | 2017 | % of total | % change 2016 to 2017 | 5-year trend % growth |
|---|---|---|---|---|---|---|---|
| 1 | United States | 876.4 | 853.2 | 896.9 | 27.5 | 5.1 | 6.9 |
| 2 | United Kingdom | 481.4 | 520.7 | 481.4 | 14.7 | -7.6 | 4.2 |
| 3 | Belgium | 247.1 | 270.1 | 305.3 | 9.3 | 13.0 | 9.6 |
| 4 | Japan | 201.6 | 215.7 | 219.2 | 6.7 | 1.6 | 7.6 |
| 5 | Hong Kong (SAR of China) | 86.3 | 102.2 | 116.6 | 3.6 | 14.1 | 17.0 |
| 6 | Singapore | 98.7 | 91.2 | 82.0 | 2.5 | -10.1 | 5.6 |
| 7 | Luxembourg | 60.3 | 74.5 | 81.0 | 2.5 | 8.8 | 4.7 |
| 8 | Netherlands | 66.3 | 76.6 | 79.0 | 2.4 | 3.2 | 15.9 |
| 9 | China | 75.4 | 84.1 | 65.0 | 2.0 | -22.8 | 21.6 |
| 10 | Switzerland | 54.2 | 58.5 | 53.7 | 1.6 | -8.2 | -2.7 |
| 11 | Canada | 38.3 | 41.6 | 47.3 | 1.4 | 13.8 | 9.8 |
| 12 | Germany | 41.0 | 43.3 | 47.2 | 1.4 | 9.0 | 16.1 |
| 13 | New Zealand | 39.7 | 44.9 | 45.1 | 1.4 | 0.3 | 9.9 |
| 14 | Bermuda | 25.1 | 27.0 | 28.9 | 0.9 | 7.1 | 25.7 |
| 15 | Republic of Korea | 23.4 | 25.0 | 26.3 | 0.8 | 5.3 | 12.8 |
| 16 | France | 22.0 | 28.0 | 24.8 | 0.8 | -11.5 | 8.6 |
| 17 | Virgin Islands, British | 22.9 | 24.2 | 24.3 | 0.7 | 0.6 | 5.3 |
| 18 | Ireland | 20.5 | 26.1 | 23.8 | 0.7 | -9.0 | 10.5 |
| 19 | Malaysia | 20.4 | 21.3 | 21.3 | 0.7 | -0.1 | 4.0 |
| 20 | Norway | 13.5 | 15.8 | 19.9 | 0.6 | 25.8 | 23.4 |
| All economies | 3,033.2 | 3,181.7 | 3,266.4 | 2.7 | 7.6 |
Australian Citizenship
In 2016-17, a total of 137,750 people become Australian citizens by conferral from at least 190 different countries.
The following table shows the number of people who were conferred as Australian citizens in 2016-17, according to their former nationality.
|
Former nationality
|
Persons
|
Per cent
|
|---|---|---|
| India |
24,181
|
18
|
| United Kingdom |
21,061
|
15
|
| Philippines |
9112
|
7
|
| China, Peoples Republic of |
6578
|
5
|
| South Africa |
4906
|
4
|
| Sri Lanka |
4487
|
3
|
| Pakistan |
4480
|
3
|
| Ireland, Republic of |
4286
|
3
|
| Vietnam |
3859
|
3
|
| New Zealand |
3593
|
3
|
| Other |
51,207
|
37
|
| Total |
137,750
|
100
|


