The US has a population of 325 million in 2017 and according to US State department passport statistics, 21 million passports have been issued in 2017. About 136 million valid US passports is in circulation.
This makes only 41.8% of population have US passports. This also means 6 out of 10 Americans do not have passports and do not travel abroad.
The State Department received 19,603,630 passport applications for FY2017
| Fiscal Year | U.S. Passports Issued |
|---|---|
| 2017 | 21,378,994 (includes 2,511,778 passport cards) |
| 2016 | 18,676,547 (includes 2,110,555 passport cards) |
| 2015 | 15,556,216 (includes 1,647,413 passport cards) |
| 2014 | 14,087,341 (includes 1,463,191 passport cards) |
| 2013 | 13,529,757 (includes 1,408,865 passport cards) |
| 2012 | 13,125,829 (includes 1,300,145 passport cards) |
| 2011 | 12,613,153 (includes 1,173,092 passport cards) |
| 2010 | 14,794,604 (includes 1,556,392 passport cards) |
| 2009 | 14,170,171 (includes 1,544,718 passport cards) |
| 2008 | 16,132,536 (includes 189,560 passport cards) |
Passports issued by US States
California issued 2.8 million passports than any other state in the US, followed by Texas, New York and Florida. American Samoa issued only 1997 passports fo 2017.
| State | Passports Issued FY 2017 |
| CALIFORNIA | 2,837,901 |
| TEXAS | 1,522,930 |
| NEW YORK | 1,480,475 |
| FLORIDA | 1,227,361 |
| ILLINOIS | 791,802 |
| NEW JERSEY | 722,184 |
| PENNSYLVANIA | 701,216 |
| MASSACHUSETTS | 518,658 |
| VIRGINIA | 517,801 |
| WASHINGTON | 503,297 |
| OHIO | 489,910 |
| GEORGIA | 487,671 |
| MICHIGAN | 456,486 |
| NORTH CAROLINA | 432,688 |
| MARYLAND | 402,525 |
| ARIZONA | 379,962 |
| COLORADO | 374,114 |
| MINNESOTA | 371,003 |
| WISCONSIN | 298,385 |
| SOUTH CAROLINA | 280,237 |
| MISSOURI | 276,923 |
| INDIANA | 263,999 |
| CONNECTICUT | 249,947 |
| OREGON | 248,500 |
| TENNESSEE | 242,532 |
| DISTRICT OF COLUMBIA | 196,849 |
| UTAH | 183,787 |
| PUERTO RICO | 171,894 |
| NEVADA | 167,595 |
| OKLAHOMA | 158,915 |
| LOUISIANA | 148,990 |
| KENTUCKY | 146,064 |
| IOWA | 144,933 |
| ALABAMA | 141,360 |
| KANSAS | 128,895 |
| HAWAII | 93,870 |
| NEW HAMPSHIRE | 92,589 |
| ARKANSAS | 89,980 |
| NEBRASKA | 89,101 |
| NEW MEXICO | 87,923 |
| MAINE | 86,303 |
| IDAHO | 85,739 |
| MONTANA | 68,772 |
| RHODE ISLAND | 66,631 |
| MISSISSIPPI | 66,111 |
| ALASKA | 55,608 |
| DELAWARE | 52,628 |
| WEST VIRGINIA | 42,122 |
| NORTH DAKOTA | 39,422 |
| VERMONT | 38,054 |
| WYOMING | 26,151 |
| GUAM | 15,849 |
| VIRGIN ISLANDS | 9,984 |
| NORTHERN MARIANAS | 3,893 |
| SOUTH DAKOTA | 3,706 |
| AMERICAN SAMOA | 1,799 |
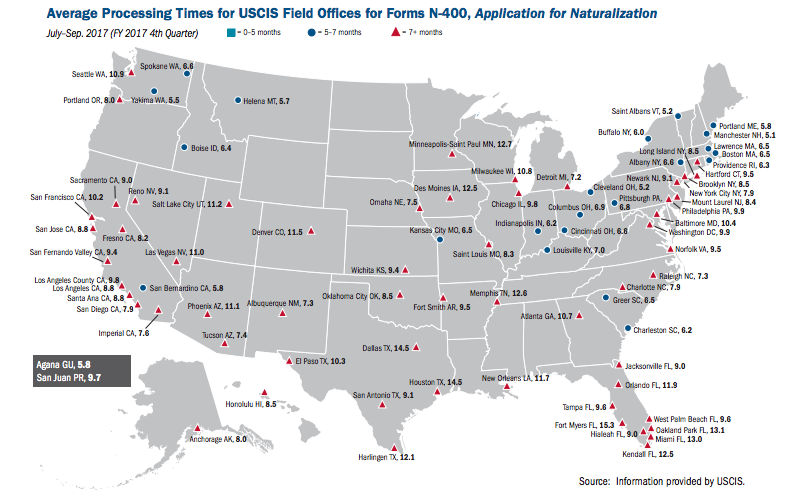
Naturalisation applications
As of Q1 2018, there are 747,383 pending N-400 naturalisation applications with USCIS. In 2018 218,248 N-400 applications received, 174,984 approved , 22,599 denied.
In New York alone, over 90,000 applications pending in 2018 according to USCIS report as of 31 March 2018.


