On July 27, 2018, the Executive Board of the International Monetary Fund (IMF) concluded the Article IV consultation1 with Greece.
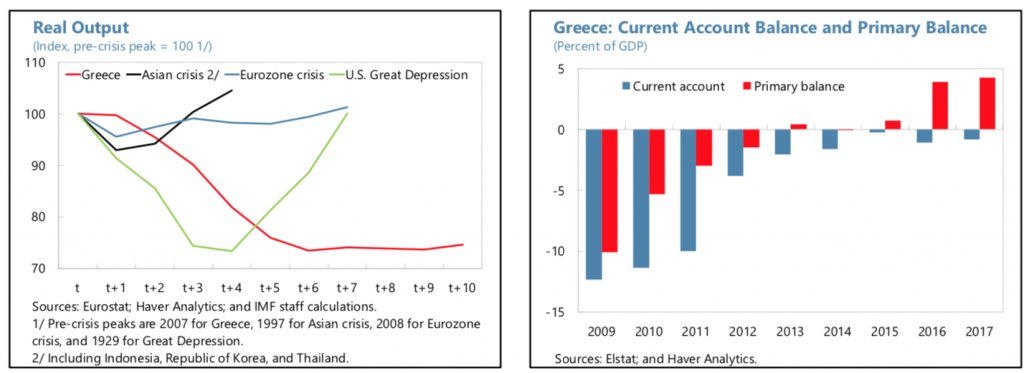
Following a deep and protracted contraction, growth has finally returned to Greece. The large macroeconomic stabilization effort, structural reforms has contributed to an increase in real GDP of 1.4 percent in 2017.

The recovery is projected to strengthen in the near-term, with growth expected to reach 2 percent this year and 2.4 percent in 2019, and with unemployment declining as the output gap closes.
IMF Executive Directors commended the authorities for important reforms and policy choices in recent years that have largely eliminated fiscal and current account imbalances, stabilized the financial sector, reduced unemployment, and restored growth. These substantial efforts, along with welcome debt relief by European partners, have put Greece on a path to successfully exit the European Stability Mechanism-supported program in August 2018.
IMF report said, as of end-March 2018, Greek banks’ non-performing exposures (NPEs) were among the highest in the EU at 49 percent of total loans, with a coverage ratio of 49 percent. Banks have so far met the NPE reduction targets submitted to the Single Supervisory Mechanism (SSM), but in large part because the targets are backloaded.
IMF has projected the current Greece debt 188% of GDP in 2018 to reduce in the future.
In July 2017, the government issued a €3 billion five-year bond with a 4.4 percent coupon (sold mainly to foreign investors), half of which was used for liability management.
| Greece: Selected Economic Indicators | ||||||||
| Population (millions of people) | 10.8 | Per capita GDP (€’000) | 16.5 | |||||
| IMF quota (millions of SDRs) | 2,428.9 | Literacy rate (percent) | 97.1 | |||||
| (Percent of total) | 0.51 | Poverty rate (percent) | 35.7 | |||||
| Main products and exports: tourism services; shipping services; food and beverages; industrial products; petroleum products; chemical products. | ||||||||
| Key export markets: E.U. (Italy, Germany, Bulgaria, Cyprus, U. K.), Turkey, U.S. | ||||||||
| 2016 | 2017 | 2018 | 2019 | 2020 | 2021 | 2022 | 2023 | |
| (proj.) | ||||||||
| Output | ||||||||
| Real GDP growth (percent) | -0.2 | 1.4 | 2.0 | 2.4 | 2.2 | 1.6 | 1.2 | 1.2 |
| Employment | ||||||||
| Unemployment rate (percent) | 23.6 | 21.5 | 19.9 | 18.1 | 16.3 | 15.2 | 14.4 | 14.1 |
| Prices | ||||||||
| CPI inflation (period avg., percent) | 0.0 | 1.1 | 0.7 | 1.2 | 1.5 | 1.7 | 1.7 | 1.7 |
| General government finances (percent of GDP) 1/ | ||||||||
| Revenue | 50.2 | 49.0 | 48.7 | 47.1 | 46.4 | 45.8 | 45.0 | 45.0 |
| Expenditure | 49.5 | 48.0 | 48.1 | 47.2 | 46.2 | 45.5 | 44.9 | 45.4 |
| Overall balance | 0.7 | 1.1 | 0.5 | -0.1 | 0.2 | 0.3 | 0.1 | -0.4 |
| Overall balance (excl. program adjustors) | 0.6 | 0.8 | … | … | … | … | … | … |
| Primary balance | 3.9 | 4.2 | 3.5 | 3.5 | 3.5 | 3.5 | 3.5 | 3.0 |
| Public debt | 183.5 | 181.8 | 188.1 | 177.1 | 169.6 | 162.9 | 155.3 | 151.3 |
| Money and credit | ||||||||
| Broad money (percent change) | 2.2 | 5.7 | … | … | … | … | … | … |
| Credit to private sector (percent change) | -4.5 | -5.8 | … | … | … | … | … | … |
| 3-month T-bill rate (percent) | 3.1 | 2.3 | … | … | … | … | … | … |
| Balance of payments | ||||||||
| Current account (percent of GDP) | -1.1 | -0.8 | -0.7 | -0.4 | -0.3 | -0.2 | -0.1 | 0.0 |
| FDI (percent of GDP) | -2.4 | -1.7 | -1.7 | -1.7 | -1.6 | -1.6 | -1.6 | -1.5 |
| External debt (percent of GDP) | 247.8 | 227.9 | 221.3 | 209.7 | 199.7 | 190.2 | 182.5 | 177.6 |
Source: IMF


