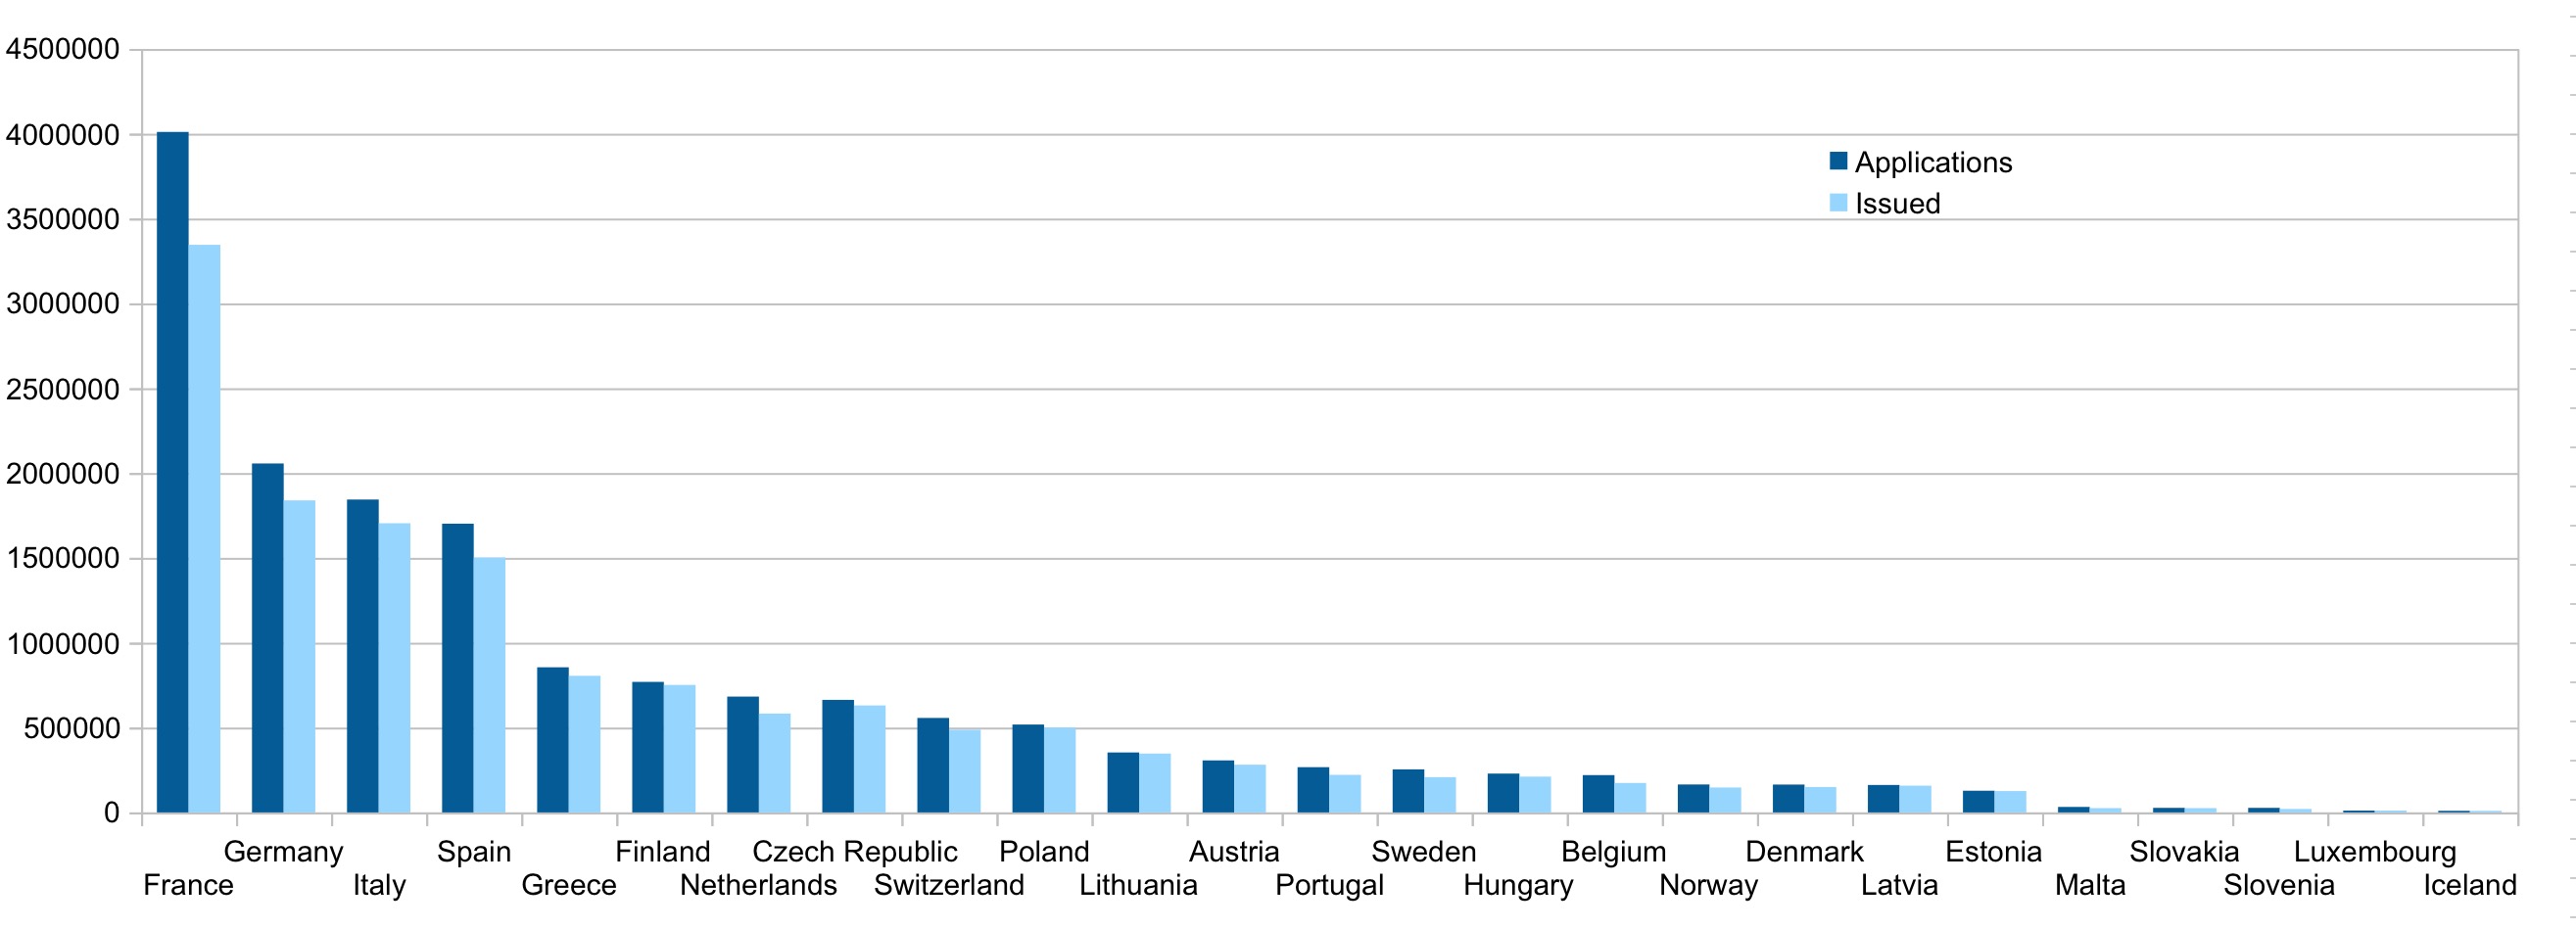
EU has published schengen visa report for 2018. According to the report, an estimated 14.2 million uniform schengen visas, including multiple entry visas. In addition to visas issued at consulates, Schengen States also issued 66 000 uniform visas at the external borders.
Here is the quick summary.
- France issued most schengen visas than any other schengen country (3.3 million visas), followed by Germany and Italy
- EU schengen states received 16 million visa applications for 2018
- Russians and chinese top the table for receiving schengen visas.
- Chinese applying for schengen visas increased by 11.3% compared to previous year to 2.8 million applications
- Despite Russia top country for schengen visas, number of applications in the Russian Federation, decreased almost 5% to 3.7 million
- Applications lodged in India surpassed the 1-million-mark for the first time, registering an increase of 17.4%
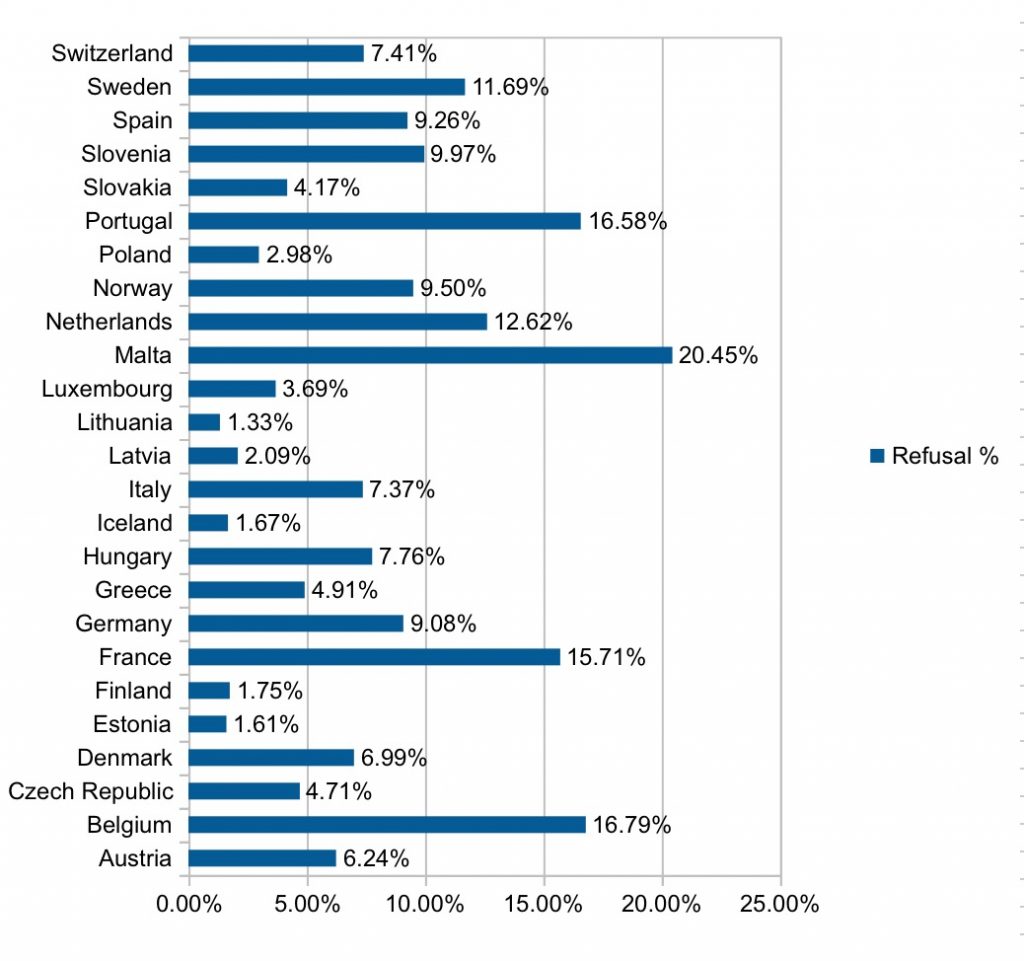
- Malta, Belgium, Portugal have high refusal rates for uniform visas above 15%.
- Worldwide, 9.6% of all visa applications were refused.
- Schengen visa applications lodged in Belarus declined by 4.8%, Turkey by 9.5%) and Algeria by 8.8%)
- Visa applications plunged from Ukraine by 73% due to new visa waiver for ukraine nationals.
Top countries
- France – 3.3 million
- Germany – 1.8 million
- Italy – 1.7 million
- Spain – 1.5 million
- Greece – 805K

Top countries receiving schengen visas
- Russia – 3.6 million
- China – 2.8 million
- India – 0.9 million

| Schengen State | Sum – Uniform visas applied | Sum – Total uniform visas issued (including MEV) | Sum – Multiple entry uniform visas (MEVs) issued | LTVs issued (Local territory visas) | Sum – Uniform visas not issued | Refusal % |
| France | 4010604 | 3345400 | 1030034 | 3311 | 629997 | 15.71% |
| Germany | 2056296 | 1838775 | 1555031 | 30822 | 186699 | 9.08% |
| Italy | 1844140 | 1703912 | 1234338 | 4346 | 135882 | 7.37% |
| Spain | 1701379 | 1502696 | 659280 | 5871 | 157494 | 9.26% |
| Greece | 855285 | 805115 | 595272 | 8157 | 42013 | 4.91% |
| Finland | 769049 | 751358 | 670112 | 3052 | 13439 | 1.75% |
| Netherlands | 682382 | 582344 | 459448 | 5441 | 86123 | 12.62% |
| Czech Republic | 662902 | 630071 | 173259 | 1510 | 31206 | 4.71% |
| Switzerland | 556520 | 487014 | 293960 | 28276 | 41230 | 7.41% |
| Poland | 518003 | 501011 | 378243 | 1548 | 15423 | 2.98% |
| Lithuania | 353059 | 346476 | 294862 | 150 | 4701 | 1.33% |
| Austria | 306133 | 280847 | 154902 | 6188 | 19098 | 6.24% |
| Portugal | 266516 | 221009 | 110999 | 1328 | 44179 | 16.58% |
| Sweden | 253292 | 207643 | 57817 | 8591 | 29604 | 11.69% |
| Hungary | 228793 | 210827 | 109647 | 204 | 17762 | 7.76% |
| Belgium | 219827 | 173598 | 86522 | 913 | 36906 | 16.79% |
| Norway | 164591 | 146526 | 32085 | 2560 | 15633 | 9.50% |
| Denmark | 164003 | 149744 | 72905 | 154 | 11472 | 6.99% |
| Latvia | 161709 | 157628 | 124273 | 83 | 3374 | 2.09% |
| Estonia | 127561 | 125465 | 112768 | 48 | 2048 | 1.61% |
| Malta | 32331 | 24931 | 7611 | 192 | 6611 | 20.45% |
| Slovakia | 26797 | 25230 | 16610 | 450 | 1118 | 4.17% |
| Slovenia | 26403 | 20171 | 18385 | 3600 | 2632 | 9.97% |
| Luxembourg | 10876 | 10467 | 8265 | 8 | 401 | 3.69% |
| Iceland | 9334 | 8856 | 2610 | 156 | 1.67% |
Refusal Rate
Malta, Portugal, Belgium, Netherlands have high refusal rates
The percentage of applications that were refused varied widely and ranged from less than 2% (Belarus, Indonesia and Russia) to more than 35% (Algeria, Central African Republic, Comoros, DR Congo, Eritrea, Ghana, Guinea, Haiti, Iraq, Nigeria and Senegal).
Worldwide, 9.6% of all visa applications were refused, 1.4 percentage points more than in 2017. 58% of visas issued in 2018 allowed for multiple entries into the Schengen area, a similar figure as 2017.
Top countries for refusals
- Malta
- Belgium
- Portugal
- France


